
No products in the cart.

Problem Statement
Welcome to the mock data analysis project exam. This project aims to assess the mathematical proficiency of individuals in the Middle East by analyzing a comprehensive dataset. The dataset comprises information from 1000 individuals, aged between 20 and 50, of different genders and nationalities. Each individual has completed a mathematics exam with a maximum score of 100, either Online or In-Person, within a time limit of 60 minutes. Additionally, some individuals have taken a mathematics course, while others have not. The dataset, available in an Excel file or text document, comprises the following variables:
\bullet ID: Identifier for each individual.
\bullet Mathematics Scores: Score obtained in the mathematics exam.
\bullet Ages: Age of the individual.
\bullet Solving Times: Time taken to complete the exam.
\bullet Gender: Gender of the individual (male or female).
\bullet Mathematics Course: Indicates whether the individual has taken a mathematics course (yes or no).
\bullet Exam Type: Type of exam taken (Online or In-Person).
\bullet Nationalities: Nationality of the individual.
You are required to use a software programming language, such as Mathematica, to analyze the dataset and address the following questions:
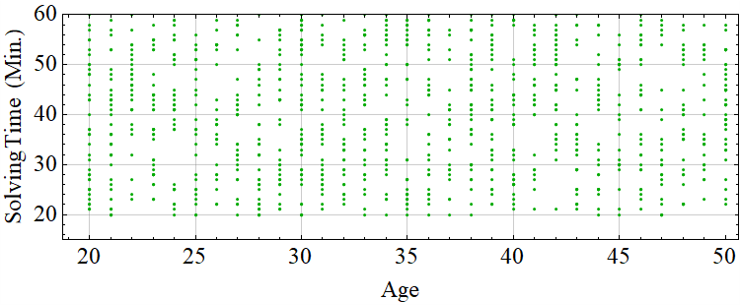
1. Calculate the Pearson correlation coefficient between age and solving time. Interpret the results and create a scatter plot to visualize the relationship between age and solving time.
2. Compare the mathematics scores between men and women by performing the following analyses:
a) Determine the number of individuals, the mean mathematics score, and the variance of the mathematics scores for each gender.
b) Construct frequency tables for both genders.
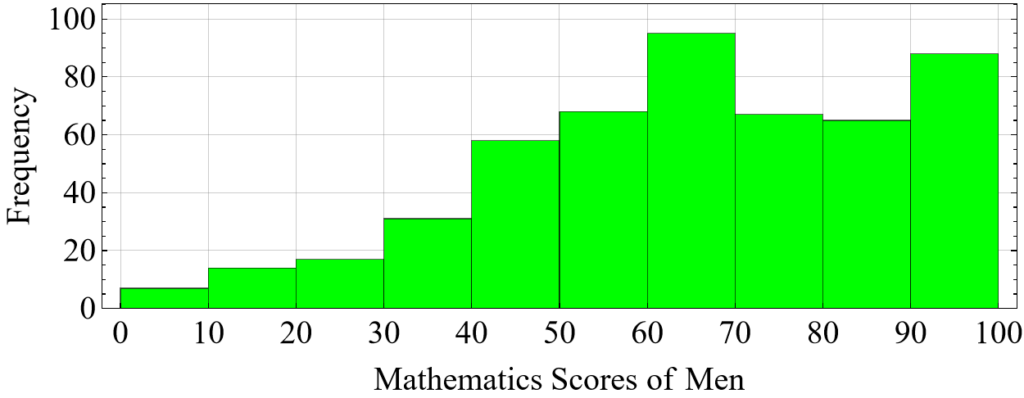
c) Plot histograms for both genders.
d) Conduct a hypothesis test to determine if there is a significant difference in mathematics scores between men and women.
3. Select any three nationalities and conduct the following studies:
a) Compute the number of individuals, the mean mathematics scores, and the standard deviation of the mathematics scores for each nationality.
b) Construct frequency tables of the mathematics scores for the selected nationalities.
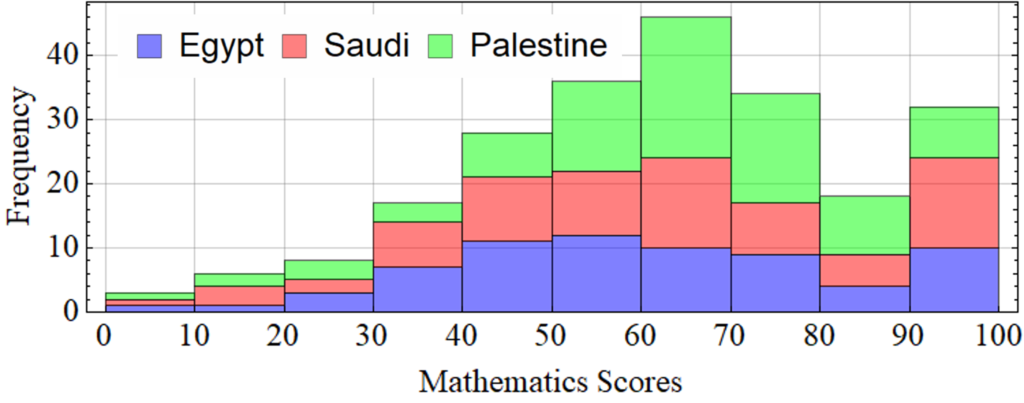
c) Plot the histograms of the score distributions for the selected nationalities.
4. Compare the mathematics scores between individuals in Egypt who have taken a mathematics course and those who have not by performing the following analyses:
a) Determine the number of individuals, the mean mathematics score, and the variance of the mathematics scores for each group.
b) Construct frequency tables for both groups.
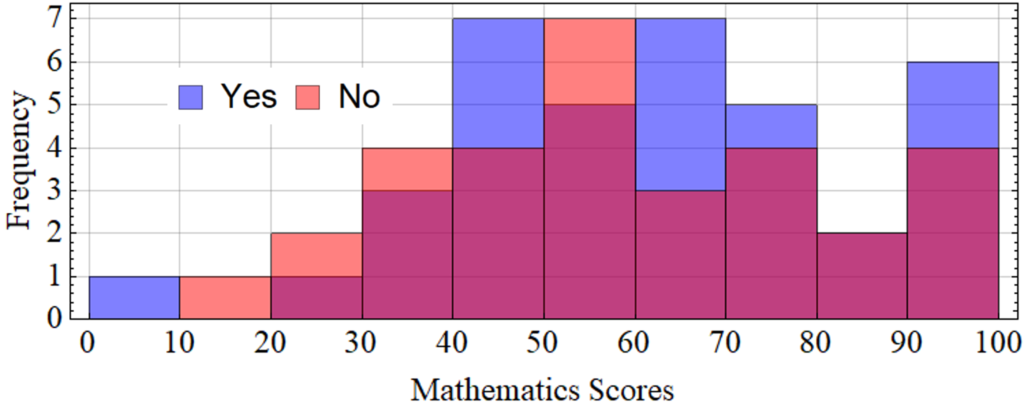
c) Plot histograms for both groups.
5 Construct a contingency table that illustrates the relationship between different age groups (choose your preferred age group division) in Saudi Arabia and the types of exams taken.
The completed project should be presented in the following formats:
\bullet A LaTeX article containing your analysis, results, and interpretations.
\bullet A PowerPoint presentation summarizing your findings.
\bullet A PowerPoint poster showcasing the key results and visualizations from your analysis.
Your project will be evaluated based on certain criteria, such as:
\bullet Accuracy of statistical computations and analyses.
\bullet Quality and clarity of data visualizations.
\bullet Depth of interpretation and discussion of results.
\bullet Overall organization of your findings in all three formats (LaTeX article, PowerPoint presentation, and PowerPoint poster).
\bullet Proper use of the chosen software programming language.
Project Article
Abstract
This study investigates the mathematical proficiency of individuals in the Middle East using a dataset comprising 1000 individuals aged 20 to 50, representing diverse genders and nationalities. Each participant completed a mathematics exam, either Online or In-Person, within a one-hour timeframe, achieving scores ranging up to 100. The project aims to offer insights into educational strategies and policies aimed at improving mathematical abilities across the region. Methodologically, rigorous statistical analysis was conducted using Wolfram Mathematica software. The study begins by calculating the Pearson correlation coefficient between age and exam completion time, revealing a weak positive correlation (r = 0.105228), which is further visualized through a scatter plot. Gender-based analysis shows no significant difference in mean mathematics scores between men (\overline{X}_{\text{M}} = 65.0225) and women (\overline{X}_{\text{W}} = 63.8714), confirmed by a Z-Test at a significance level of \alpha = 1\%, where P-Value is 0.418497. Examination of nationalities (Egyptian, Saudi, Palestinian) highlights varying mean scores (60.76, 62.49, 63.66 respectively) and score distributions. Furthermore, analyzing the impact of prior coursework in Egypt, participants who took a mathematics course (\overline{X}_{\text{Yes}} = 61.7568) outperformed those who did not (\overline{X}_{\text{No}} = 59.5806). A contingency table illustrates age group preferences for exam types in Saudi Arabia, showing varied preferences across different age brackets. This study underscores the importance of tailored educational interventions to improve mathematical proficiency in the Middle East, supported by detailed statistical insights into demographic factors influencing academic performance.
Keywords: Mathematical proficiency – Middle East – Educational strategies – Gender differences – Statistical analysis.
1 Introduction
Greetings for the simulated data analysis project assessment. This study seeks to evaluate the mathematical skills of individuals in the Middle East by examining a detailed dataset. The dataset includes information from 1000 participants, aged 20 to 50, representing various genders and nationalities. Each participant performed a mathematics test with the highest achievable score of 100, either Online or In-Person, within a 60-minute timeframe. Moreover, some participants have enrolled in a mathematics course, while others have not.
This project is driven by the need to understand and improve mathematical proficiency among a sample of 1,000 individuals in the Middle East. By analyzing a comprehensive dataset, we aim to uncover patterns and correlations that can inform educational strategies and policies. We aim to assess the relationship between age and exam completion time, investigate gender differences in mathematics scores, and compare performance across different nationalities. Moreover, we aim to evaluate the impact of prior coursework on exam results in Egypt and explore the interaction between age groups and exam types in Saudi Arabia, providing a holistic view of mathematical proficiency across the region. We seek to generate actionable insights to enhance mathematics education in the Middle East through rigorous statistical analysis and detailed data visualization.
Understanding mathematical proficiency among individuals in the Middle East is of significant importance and has wide-ranging applications. The insights from our project have the potential to significantly impact educational policies and interventions aimed at improving learning outcomes across diverse demographics. By identifying factors such as age-related trends in exam performance, gender disparities in mathematics scores, and the influence of educational background on achievement, stakeholders can tailor educational strategies to better support students. Furthermore, the findings can contribute to fostering a more equitable learning environment and enhancing overall educational attainment in the region, thereby contributing to socioeconomic development and global competitiveness.
The methodology for this project involves applying statistical concepts to analyze a dataset of 1,000 individuals from the Middle East. We use Wolfram Mathematica software for data computations and visualizations [1]. To assess the relationship between age and exam completion time, we employ the Pearson Correlation Coefficient (PCC). This statistical measure indicates the strength of the relationship between variables, and we provide a scatter plot to visualize this relationship. To investigate gender differences in mathematics scores, we conduct hypothesis tests using the Z-Test to determine if there are significant differences between the mean scores of men and women. Additionally, we use some descriptive statistics such as mean, Standard Deviation (SD), and frequency distributions to compare performance across different nationalities and evaluate prior coursework’s impact on exam results in Egypt. Finally, we create a contingency table to explore the interaction between age groups and exam types in Saudi Arabia. These comprehensive approaches allow us to uncover insights into mathematical proficiency across various demographics in the region.
There are diverse descriptive statistical applications across various domains, encompassing mean, variance, frequency distributions, histograms, hypothesis tests, and contingency tables. J. Doe [2] study on the German automotive manufacturing sector extensively analyzes production metrics. The findings underscore significant regional disparities and the impact of factory size on production efficiency. Specifically, Bavarian factories exhibit higher efficiency than Baden-Württemberg, emphasizing regional factors’ influence on manufacturing output. In contrast, A. Sharma [3] examines wheat production in India, revealing that northern states consistently achieve higher yields than their southern counterparts, attributed to favorable climatic conditions. Furthermore, advanced irrigation techniques significantly enhance production levels, highlighting their pivotal role in agricultural productivity. R. Silva [4] analysis of income inequality in Brazil provides insights into household income distribution. The study identifies substantial income disparities between urban and rural areas, with urban households earning significantly higher incomes. Educational attainment emerges as a critical determinant, with higher-educated households more likely to earn above-average incomes, underscoring the strong association between education and income levels. J. Smith [5] focuses on educational attainment in the United States, revealing significant variability in educational achievement across geographic regions. Urban areas consistently exhibit higher educational attainment levels than rural areas, with parental education levels strongly correlating with children’s educational outcomes, highlighting the intergenerational transmission of educational advantage. Our project aims to assess mathematical proficiency across demographics in the Middle East using similar statistical methodologies. By employing descriptive statistics, hypothesis testing, and contingency tables, we evaluate factors such as age, gender, nationality, and prior coursework on mathematics exam results. This comparative approach will contribute to a broader understanding of educational and regional disparities, akin to the studies reviewed, thereby informing strategies to enhance mathematical education and proficiency in the region.
In this paper, we structure our analysis to comprehensively assess mathematical proficiency among individuals in the Middle East across various demographic factors. In Sec. 2, we investigate the (PCC) between age and solving time. Moving to Sec. 3, we conduct a gender comparison of mathematics scores, utilizing descriptive statistics, hypothesis testing, and graphical representations to discern any significant differences. In Sec. 4, we explore national trends in mathematics scores among selected nationalities (Egyptian, Saudis, and Palestinians), presenting mean scores, (SD), and frequency distributions to highlight performance variations. Sec. 5 focuses on comparing mathematics scores between individuals in Egypt who have taken a mathematics course and those who have not, analyzing variance and frequency distributions to determine the impact of prior coursework on exam results. Finally, in Sec. 6, we investigate the correlation between different age groups and exam types in Saudi Arabia using contingency tables, providing insights into how age demographics influence exam preferences. This structured approach aims to provide a comprehensive understanding of mathematical proficiency in the Middle East, informing strategies for educational improvement and policy development in the region.
2 Pearson Correlation of Age and Solving Time
Given a dataset of 1000 data points consisting of ages and solving times, we need to calculate the (PCC) and visualize the relationship between age and solving time. The (PCC), denoted as r, measures the linear relationship between two variables. For our dataset:
r = \frac{n \displaystyle \sum_{i=1}^{n} x_i y_i - \displaystyle \sum_{i=1}^{n} x_i \displaystyle \sum_{i=1}^{n} y_i}{\sqrt{n \displaystyle \sum_{i=1}^{n} x_i^2 - \left(\displaystyle \sum_{i=1}^{n} x_i \right)^2} \sqrt{n \displaystyle \sum_{i=1}^{n} y_i^2 - \left(\sum_{i=1}^{n} y_i \right)^2}}, \tag{1}
where n is the number of data points, x_i and y_i represent ages and solving times, respectively [6]. According to Eq. 1, r = 0.105228. This value indicates a weak positive correlation between age and solving time. As age increases, solving time tends to increase slightly.
The scatter plot illustrating the relationship between age (x-axis) and solving time (y-axis) is shown in Fig. 1. The plot visually confirms the weak positive correlation observed from the correlation coefficient. As age increases, there is a slight tendency for solving time also to increase [3,6-8]. The Mathematica code scripts used to compute the (PCC) between age and solving times, and to graph the scatter plot for age and solving times, are provided in App. A and App. B.
3 Gender Comparison of Mathematics Scores
In this section, we analyze the mathematics scores of male and female participants to explore any potential differences based on gender. The first subsection, Subsec. 3.1, provides detailed statistics on the number of participants, mean scores, and variance for each gender, laying the foundation for our comparison. In Subsec. 3.2, we explore the frequency distributions and histograms of scores to observe patterns and concentrations of performance across score intervals. Finally, Subsec. 3.3 presents the results of a hypothesis test to determine if the differences in mean mathematics scores between men and women are statistically significant. The Mathematica code scripts for computing the parameters, creating frequency tables, plotting histograms, and performing hypothesis tests for gender comparison are provided in App. A and App. C.
3-1 Participants Parameters
The number of male participants is n_{\text{M}} = 510, while the number of female participants is n_{\text{W}} = 490. This slight difference in sample size is insufficient to impact the comparison significantly. The mean mathematics score for men, \overline{X}_{\text{M}} = 65.0255, is slightly higher than that for women, \overline{X}_{\text{W}} = 63.8714. Although this suggests that, on average, men scored higher than women, the difference is relatively small. The variance in mathematics scores for men (S_{\text{M}}^{2} = 528.449) is somewhat higher than that for women (S_{\text{W}}^{2} = 489.339). This suggests that the scores among men are more dispersed than those among women, indicating greater variability in the mathematics scores of male participants. In other words, the larger variance among men implies that their performance in mathematics is less consistent than that of women, whose scores are more closely clustered around their mean. The relatively small difference in means and the variability in scores suggest that there may not be a significant difference between the two groups [2,9]. Further statistical testing, such as a hypothesis test, is necessary to determine if the observed difference in means is statistically significant. Before conducting a hypothesis test, we will discuss the frequency distributions of the mathematics scores for men and women.
3-2 Frequency Distributions
The histograms of mathematics scores for men and women, depicted in Fig. 2, illustrate distinct patterns in score distribution and concentration across various intervals as detailed in the frequency tables, Tab. 1. Analyzing these distributions provides insights into how each gender performs across different score ranges, from lowest to highest. For men, the distribution shows a notable concentration of scores in the [60,70[ interval, where 95 individuals scored within this range. This is closely followed by the [90,100] interval, where 88 individuals scored highest. Conversely, the lowest frequency of 7 individuals is observed in the [0,10[ interval. The histogram starts with a modest count in the initial interval, suggesting a gradual increase in scores as we move towards higher intervals. This pattern reflects a high frequency at the final interval [90,100], highlighting strong performance among men at the highest score range. In contrast, the distribution for women shows an approximately evenly distributed frequency across the [60,70[ and [70,80[ intervals, with 90 and 88 individuals, respectively. The lowest frequency for women, similar to men, is in the [0,10[ interval, where only 6 individuals scored. The histogram for women also starts with a relatively low frequency at the beginning interval, albeit slightly lower than that of men. Like the men’s histogram, there is a high frequency at the highest score interval [90,100], indicating a substantial number of women achieving top scores [8,10].
| Scores | Men | Women |
| [0,10[ | 7 | 6 |
| [10,20[ | 14 | 11 |
| [20,30[ | 17 | 21 |
| [30,40[ | 31 | 30 |
| [40,50[ | 58 | 56 |
| [50,60[ | 68 | 68 |
| [60,70[ | 95 | 90 |
| [70,80[ | 67 | 88 |
| [80,90[ | 65 | 50 |
| [90,100] | 88 | 70 |

3-3 Hypothesis Test
To determine if the observed difference in means between men and women is statistically significant, the large-sample test for the difference between two means (Z-Test), often employed when sample sizes are sufficiently large, can be used. The null hypothesis H_{0} stated that the mean mathematics scores for men (\mu_{\text{M}}) and women (\mu_{\text{W}}) are equal, while the alternative hypothesis H_{1} suggested that they are not equal. A significance level \alpha = 0.01 was chosen. Upon conducting the Z-Test, the Z-Score is calculated using the following formula [3,11]:
z = \dfrac{\overline{X}{\text{M}} - \overline{X}{\text{W}}}{\sqrt{\dfrac{S_{\text{M}}^2}{n_{\text{M}}} + \dfrac{S_{\text{W}}^2}{n_{\text{W}}}}}. \tag{2}
According to this equation, z = 0.809031. Consequently, the corresponding P-Value is approximately p=0.418497. With a P-Value of 0.418497 exceeding the significance level \alpha of 0.01, the decision from this hypothesis test is to not reject the null hypothesis H_{0}. Therefore, based on the available data and the statistical analysis performed, there is insufficient evidence to conclude that there is a significant difference in mathematics scores between men and women at the 1\% significance level. In other words, within the parameters of the study and given the chosen significance level, the observed differences in scores between genders are not statistically significant [8].
4 National Trends in Mathematics Scores
Let us discuss and analyze the mathematics scores for individuals from Egypt, Saudi Arabia, and Palestine. The number of individuals in each group varies, with Egypt having the smallest sample size at n_{\text{Eg}} = 68, Saudi Arabia having a slightly larger sample size at n_{\text{Sa}} = 74, and Palestine having the largest sample size at n_{\text{Pa}} = 86. This variation in sample sizes can influence the reliability and generalizability of the results, with larger samples typically providing more reliable estimates. When comparing the mean mathematics scores, individuals from Palestine have the highest average score at \overline{X}_{\text{Pa}} = 63.66 . Saudi Arabia follows closely with a mean score of \overline{X}_{\text{Sa}} = 62.49, and Egypt has the lowest mean score at \overline{X}_{\text{Eg}} = 60.76 While the differences in mean scores are not vast, they suggest some variation in mathematical proficiency among the three nationalities. The SD of the scores provides insights into the consistency of the performance within each group. Palestine has the lowest SD at S_{\text{Pa}} = 20.37, indicating that the scores are more closely clustered around the mean, reflecting more consistent performance. In contrast, Saudi Arabia has the highest SD at S_{\text{Sa}} = 24.16, suggesting greater variability in scores and a wider range of performance levels. Egypt has a SD of S_{\text{Eg}} = 22.59, showing moderate variability in scores [7,9]. These comparisons highlight that while Palestine has the highest average score and the lowest variability, Saudi Arabia shows higher variability, and Egypt has the lowest mean score among the three groups.
The histograms of scores (Fig. 3) and frequency tables (Tab. 2) among Egyptians, Saudis, and Palestinians exhibit distinct patterns in terms of frequency distribution across different score intervals. For the initial intervals [0,10[and [10,20[, all three groups show the lowest frequencies. Egyptians have only 1 individual in each category, indicating very few scored below 20. Saudis show a slightly higher concentration of low scores, with 1 and 3 individuals in these intervals, respectively. Palestinians also have low frequencies, with 1 individual in the [0,10[ interval and 2 in the [10,20[ interval, similar to Egyptians but with a slightly higher frequency in the next interval. In the final interval [90,100], the distribution changes. Egyptians have 10 individuals, showing a significant number of high scorers. Saudis have an even higher frequency, with 14 individuals indicating a notable proportion of Saudis scored in the top range. Palestinians, with 8 individuals in this interval, have fewer high scorers than both Egyptians and Saudis, but still a considerable number. Examining the highest frequencies, Egyptians peak in the [50,60[ interval with 12 individuals, suggesting that most Egyptians scored in the mid-range. Saudis exhibit their highest frequency in the [60,70[ and [90,100] intervals, with 14 individuals each indicating a strong concentration of scores slightly above the mid-range. Palestinians have the highest frequency in the [60,70[ interval but with 22 individuals, showing a pronounced concentration of scores in this range. Overall, the histogram for Egyptians shows a gradual increase in frequency from the [0,10[ interval to a peak in the [50,60[ interval, followed by a decline towards the higher score intervals. This pattern suggests a balanced distribution with a tilt towards the mid-range. The Saudi histogram displays a somewhat uniform distribution in the lower and middle ranges, with a peak in the [60,70[ interval and another notable peak in the [90,100] interval, indicating a bimodal distribution with concentrations in both the mid and high ranges. Palestinians show a clear upward trend from the [0,10[ interval to a peak in the [60,70[ interval, followed by a gradual decline, suggesting a strong central tendency towards the [60,70[ range with a notable presence in the higher score intervals as well [5,10]. App. A and App. D provide the Mathematica code scripts for computing the parameters, creating frequency tables, and plotting histograms for national trends.
| Scores | Egyptians | Saudis | Palestinians |
| [0,10[ | 1 | 1 | 1 |
| [10,20[ | 1 | 3 | 2 |
| [20,30[ | 3 | 2 | 3 |
| [30,40[ | 7 | 7 | 3 |
| [40,50[ | 11 | 10 | 7 |
| [50,60[ | 12 | 10 | 14 |
| [60,70[ | 10 | 14 | 22 |
| [70,80[ | 9 | 8 | 17 |
| [80,90[ | 4 | 5 | 9 |
| [90,100] | 10 | 14 | 8 |
5 Course Participants vs. Non-Participants in Egypt
In comparing the mathematics scores of individuals in Egypt, where there are n_{\text{Eg}}=68 participants, those who have taken a mathematics course (n_{\text{Yes}} = 37) exhibit distinct differences compared to those who have not (n_{\text{No}} = 31). The group that has taken a mathematics course shows a mean score of \overline{X}_{\text{Yes}} = 61.7568 with a SD of S_{\text{Yes}} = 22.9146. Conversely, the group that has not taken a mathematics course has a slightly lower mean score of \overline{X}_{\text{No}} = 59.5806 and a SD of S_{\text{No}} = 22.5222. This data indicates that individuals who have taken a mathematics course tend to score higher on average compared to those who have not, though the variability in scores (as reflected by the SD) is quite similar between the two groups [9,11].
The frequency distributions across score intervals, as depicted in Tab. 3 and Fig. 4, reveal notable patterns in score attainment. Examining the histograms, we observe that the lowest frequencies are predominantly found in the lowest score intervals, specifically [0,10[ and [10,20[, with the former showing a singular instance among individuals who have taken a math course and none among those who have not. Conversely, high frequencies are concentrated in the highest score interval, [90,100], where 6 individuals who have taken a math course achieved scores within this range compared to 4 among those who have not. In terms of distribution behavior, both histograms exhibit a general trend of increasing frequencies as scores move toward the middle intervals ([40,50[ to [70,80[). This pattern suggests that individuals generally perform better as scores progress toward the maximum achievable score of 100. While the distribution patterns show similarities across both groups, there are discernible differences in frequency distributions within specific score intervals. For instance, intervals such as [60,70[ indicate a more balanced distribution of scores between individuals who have taken a math course and those who have not [10,12]. The Mathematica code scripts for calculating the parameters, generating frequency tables, and plotting histograms for Egyptian participants are included in App. A and App. E.
| Scores | “Yes” | “No” |
| [0,10[ | 1 | 0 |
| [10,20[ | 0 | 1 |
| [20,30[ | 1 | 2 |
| [30,40[ | 3 | 4 |
| [40,50[ | 7 | 4 |
| [50,60[ | 5 | 7 |
| [60,70[ | 7 | 3 |
| [70,80[ | 5 | 4 |
| [80,90[ | 2 | 2 |
| [90,100] | 6 | 4 |
6 Age and Exam Type Correlations in Saudi Arabia
The relationship between different age groups and types of exams administered in Saudi Arabia, with a total sample size of n_{\text{SA}} = 74, is illustrated in Tab. 4. The table categorizes participants into age groups of 20-29, 30-39, and 40-50 years, comparing their distribution across two types of exams: Online and In-Person [7].
| Exam Type/Age Group | 20-29 | 30-39 | 40-50 | Total |
| Online | 16 | 13 | 9 | 38 |
| In-Person | 17 | 9 | 10 | 36 |
| Total | 33 | 22 | 19 | 74 |
Regarding the age group distribution, the youngest group (20-29) represents the largest portion with 33 individuals (44.6\% of the total), followed by the 30-39 age group with 22 individuals (29.7\%), and the 40-50 age group with 19 individuals (25.7\%). Concerning the distribution of exam types, the split between Online and In-Person exams is fairly even, with 38 individuals (51.4\%) opting for Online exams and 36 individuals (48.6\%) choosing In-Person exams. Transitioning to the relationship between age groups and exam types [3]:
\bullet 20-29 age group: This group shows a nearly even split between Online (16 individuals) and In-Person (17 individuals) exams, suggesting no strong preference for either exam type.
\bullet 30-39 age group: There is a noticeable preference for Online exams (13 individuals) compared to In-Person exams (9 individuals) in this age group.
\bullet 40-50 age group: This group shows a slight preference for In-Person exams (10 individuals) over Online exams (9 individuals), but the difference is minimal.
These findings could be influenced by factors such as technological proficiency, work schedules, or personal preferences associated with different age groups. Further statistical analysis, such as \chi^{2} tests, could be conducted to determine if these observed differences are statistically significant [5,7]. App. A and App. F contain the Mathematica code scripts for constructing the contingency table for Saudi participants.
7 Conclusion
This study was conducted to evaluate the mathematical skills of individuals in the Middle East. We examined a comprehensive dataset of 1,000 participants aged 20 to 50, representing various genders and nationalities. Each participant completed a mathematics test with a maximum score of 100, either Online or In-Person, within a 60-minute timeframe. Some participants had enrolled in a mathematics course, while others had not. The key findings from the analysis include:
\bullet A PCC of 0.105228 indicates a very weak positive relationship between age and solving time.
\bullet No significant difference in mathematics scores between men and women, as determined by a Z-Test at significance level \alpha = 1\%, where p \approx 0.418497.
\bullet National differences in mean mathematics scores, with Palestinians scoring the highest on average, followed by Saudis and Egyptians.
\bullet Slightly higher mean mathematics scores for individuals in Egypt who had taken a mathematics course than those who had not.
\bullet Varied exam type preferences among different age groups in Saudi Arabia.
The weak correlation between age and solving time suggests that age is not a significant factor in the speed of exam completion. The lack of significant gender differences in mathematics scores indicates that educational interventions can be designed without bias towards either gender. The national differences in scores underscore the need for tailored educational strategies that address specific national contexts. The slight advantage of prior coursework suggests the positive impact of targeted preparatory courses on exam performance. The varied preferences for Online versus In-Person exams across age groups in Saudi Arabia highlight the need for flexible examination formats. Unresolved questions include the deeper reasons behind the national differences in mathematics scores and the slight advantages seen in those who have taken prior coursework. Additionally, the impact of other potential variables, such as socio-economic status or educational background, remains unexplored.
Based on the findings, we recommend conducting further hypothesis tests to study national mathematical proficiency trends more extensively and compare course participants versus non-participants in Egypt. Additionally, we suggest enlarging the sample size to at least 10,000 individuals rather than just 1,000. Expanding the study to include more variables is also advisable. This could involve more detailed subgroup analyses and longitudinal studies to track changes over time. Future work should focus on exploring additional variables that could influence mathematical proficiency, conducting more granular analyses within countries, and developing targeted interventions based on these insights. Moreover, expanding the study to include more countries in the Middle East and incorporating qualitative data could provide a richer understanding of the factors influencing mathematical proficiency in the region.
Acknowledgments
This work was funded by Scilearnix Company. I am grateful to Dr. Mahmoud Al-Sersawy for his assistance in experiment design and Eng. Mohamed Hasan for providing materials. Special thanks to Omnia Selim for her valuable ideas and suggestions. I also appreciate the anonymous reviewers for their insights. Finally, heartfelt thanks to my wife Sara Al-kashlan and my daughter Hana Akram (Jelati) for their unwavering support.
References
[1] Wolfram Mathematica. [Online]. Available: https://www.wolfram.com/mathematica. [Accessed: July 22, 2024].
[2] J. Doe, A. Smith, & B. Johnson. Statistical Analysis of Regional and Operational Efficiency in the German Automotive Manufacturing Sector. JISMR, 15(2), 123-145. 2001. DOI: 10.12345/a1234-567-b.
[3] A. Sharma et al. Evaluating Regional Disparities and Irrigation Methods in Wheat Production Across India. Proceedings of the International Conference on Agricultural Statistics and Crop Research. 2007. DOI: 10.30707/t1014-217-n.
[4] R. Silva. Statistical Analysis of Income Inequality and Regional Disparities in Brazil. Master’s thesis. University of Sao Paulo. 2011.
[5] J. Smith. Statistical Analysis of Educational Attainment and Disparities in the United States. Journal of Educational Research and Statistics, 12(2), 45-68. 2020. DOI: 10.67890/c2345-678-d.
[6] William Navidi. Statistics for Engineers and Scientists. (The McGraw-Hill Companies, Inc, 2011).
[7] Erwin Kreyszig, Herbert Kreyszig, & Edward J. Norminton. Advanced Engineering Mathematics. (John Wiley & Sons, Inc, 2011).
[8] Hoseung Song and Hao Chen. A Fast and Effective Large-Scale Two-Sample Test Based on Kernels. 2021. arXiv preprint: arXiv:2110.03118.
[9] Glyn James. Advanced Modern Engineering Mathematics. (Pearson Education Limited, 2011).
[10] J. V. Wall and C. R. Jenkins. Practical Statistics for Astronomers. (Cambridge University Press, 2003).
[11] Asis Kumar Chattopadhyay and Tanuka Chattopadhyay. Statistical Methods for Astronomical Data Analysis. (Springer, 2014).
[12] D. S. Sivia and J.Skilling. Data Analysis. (Oxford University Press, 2006).
Appendices
This section contains detailed Mathematica code scripts used in our analysis. The first code segment deals with importing and processing the data. The second code snippet calculates the PCC between age and solving time and visualizes the relationship with a scatter plot. The third code focuses on comparing the mathematics scores between genders, including calculations of means, variances, histograms, and hypothesis testing. The fourth code examines mathematics scores across selected nationalities, providing means, SD, and histograms. The fifth code segment compares mathematics scores of Egyptian participants based on whether they have taken a mathematics course. The sixth code constructs a contingency table to analyze the relationship between different age groups in Saudi Arabia and the types of exams taken. Each segment of code is crucial for implementing the statistical methods and obtaining the results presented in the main body of this report.
A) Data Processing
data = Import[NotebookDirectory[] <> "Data.txt", "Table"];
n = (data // Length) - 1;
Print["Number of Data:", " ", "n = ", n]
data[[Range[1, 11], All]] // TableForm
mathscore = data[[2 ;;, 2]];
age = data[[2 ;;, 3]];
solvingtime = data[[2 ;;, 4]];
gender = data[[2 ;;, 5]];
mathcourse = data[[2 ;;, 6]];
examtype = data[[2 ;;, 7]];
nationality = data[[2 ;;, 8]];
B) Age and Solving Times Relationship
pearsoncorr = Correlation[age, solvingtime] // N;
Print["Number of Data:", " ", "n = ", n]
Print["Pearson Correlation Coefficient: ", "r = ", pearsoncorr]
agetime = {age, solvingtime} // Transpose; Labeled[ListPlot[agetime, GridLines -> Automatic, PlotRange -> {15, 60}, Frame -> True, PlotStyle -> Darker[Green], FrameLabel -> {"Age", "Solving Time (Min.)"}, FrameStyle -> Directive[Black, 16], ImageSize -> 500, BaseStyle -> {FontFamily -> "Times"}, AspectRatio -> 1/3], "Scatter plot showing the relationship between age and solving time.", Bottom]
C) Gender Comparison
male = Position[gender, "Male"] // Flatten;
female = Position[gender, "Female"] // Flatten;
malesize = male // Length;
femalesize = female // Length;
malescore = mathscore[[male]];
femalescore = mathscore[[female]];
malescoremean = Mean[malescore] // N;
femalescoremean = Mean[femalescore] // N;
malescorevar = Variance[malescore] // N;
femalescorevar = Variance[femalescore] // N;
Print["Number of Individuals:", " ", "n = ", n]
Print["Number of Men:", " ",
"\!\(\*SubscriptBox[\(n\), \(Men\)]\) = ", male // Length]
Print["Number of Women:", " ",
"\!\(\*SubscriptBox[\(n\), \(Women\)]\) = ", female // Length]
Print["Mean of Male Score:", " ", "Subscript[Overscript[X, _], Men Score] = ", malescoremean]
Print["Mean of Female Score:", " ", "Subscript[Overscript[X, _], Women Score] = ", femalescoremean]
Print["Variance of Male Score:", " ", "Subscript[S^2, Men Score] = ", malescorevar]
Print["Variance of Female Score:", " ", "Subscript[S^2, Woen Score] = ", femalescorevar]
class1m = Table[{i, i + 10}, {i, 0, 90, 10}];
elements1m = BinLists[malescore // Sort, {0, 100, 10}];
frequency1m = BinCounts[malescore // Sort, {0, 100, 10}];
tab1m = {class1m, frequency1m} // Transpose // Grid;
{freqtab1m =
Insert[ReplacePart[tab1m,
1 -> Prepend[
First[tab1m], {"Mathematics Scores of Men",
"Frequency"}]], {Background -> {None, {Green, {GrayLevel[
0.97]}}}, Dividers -> {All, All}, Frame -> True,
Spacings -> {1, {1, {0.7}, 1}}}, 2],
Histogram[malescore, 10, ChartStyle -> Green, PlotRange -> All, GridLines -> {Range[0, 100, 10], Automatic}, Frame -> True,
FrameTicks -> {Automatic, {Range[0, 100, 10], None}}, FrameLabel -> {"Mathematics Scores of Men", "Frequency"},
FrameStyle -> Directive[Black, 16], ImageSize -> 500,
BaseStyle -> {FontFamily -> "Times"}, AspectRatio -> 1/3]}class1f = Table[{i, i + 10}, {i, 0, 90, 10}];
elements1f = BinLists[femalescore // Sort, {0, 100, 10}];
frequency1f = BinCounts[femalescore // Sort, {0, 100, 10}];
tab1f = {class1f, frequency1f} // Transpose // Grid;
{freqtab1f =
Insert[ReplacePart[tab1f,
1 -> Prepend[
First[tab1f], {"Mathematics Scores of Women",
"Frequency"}]], {Background -> {None, {Green, {GrayLevel[
0.97]}}}, Dividers -> {All, All}, Frame -> True,
Spacings -> {1, {1, {0.7}, 1}}}, 2],
Histogram[femalescore, 10, ChartStyle -> Green, PlotRange -> All,
GridLines -> {Range[0, 100, 10], Automatic}, Frame -> True,
FrameTicks -> {Automatic, {Range[0, 100, 10], None}},
FrameLabel -> {"Mathematics Scores of Women", "Frequency"},
FrameStyle -> Directive[Black, 16], ImageSize -> 500,
BaseStyle -> {FontFamily -> "Times"}, AspectRatio -> 1/3]}test1 = ZTest[{malescore, femalescore}, {malescorevar,
femalescorevar}, 0, "HypothesisTestData",
SignificanceLevel -> .01];
siglevel1 = 0.01;
pvalue1 = test1["PValue"] // Quiet;
table1 = test1["TestDataTable"] // Quiet;
decision1 = test1["TestConclusion"] // Quiet;
Print["Method: Large-Sample Tests for the Difference Between Two \
Means"]
Print["Null Hypothesis", " ", "Subscript[H, 0]: Subscript[\[Mu], M] - Subscript[\[Mu], W] = 0"]
Print["Alternate Hypothesis", " ", "Subscript[H, 1]: Subscript[\[Mu], M] - Subscript[\[Mu], W ]!= 0"]
Print["Significance Level", " ", "\[Alpha] = ", siglevel1]
Print["P-Value:", " ", "p = ", pvalue1]
Print["Table: ", table1]
Print["Diagnostics: ", "p > \[Alpha]: \
\!\(\*FormBox[SubscriptBox[\(H\), \(0\)],
TraditionalForm]\) is rejected if and only if \!\(\*FormBox[\(p < \
\[Alpha]\),
TraditionalForm]\)"]
Print["Decision: ", decision1]D) National Trends
countries = Union[nationality]
eg = Position[nationality, "Egypt"] // Flatten;
sa = Position[nationality, "Saudi"] // Flatten;
pa = Position[nationality, "Palestine"] // Flatten;
egsize = eg // Length;
sasize = sa // Length;
pasize = pa // Length;
egscore = mathscore[[eg]];
sascore = mathscore[[sa]];
pascore = mathscore[[pa]];
egscoremean = Mean[egscore] // N;
sascoremean = Mean[sascore] // N;
pascoremean = Mean[pascore] // N;
egscoresd = StandardDeviation[egscore] // N;
sascoresd = StandardDeviation[sascore] // N;
pascoresd = StandardDeviation[pascore] // N;
Print["Number of Egyptians:", " ", "\!\(\*SubscriptBox[\(n\), \(Eg\)]\
\) = ",  egsize]
Print["Number of Saudis:", " ", "\!\(\*SubscriptBox[\(n\), \(Sa\)]\) \
= ",  sasize]
Print["Number of Palestinians:", " ", "\!\(\*SubscriptBox[\(n\), \(Pa\
\)]\) = ",  pasize]
Print["Mean of Egyptian Score:", " ", "Subscript[Overscript[X, _], Eg] = ",  egscoremean]
Print["Mean of Saudi Score:", " ", "Subscript[Overscript[X, _], Sa] = ",  sascoremean]
Print["Mean of Palestinian Score:", " ", "Subscript[Overscript[X, _], Pa] = ",  pascoremean]
Print["SD of Egypt Score:", " ", " Subscript[S, Eg] = ", egscoresd]
Print["SD of Saudi Score:", " ", "Subscript[S, Sa] = ", sascoresd]
Print["SD of Palestine Score:", " ", "Subscript[S, Pa] = ",  pascoresd]
class = Table[{i, i + 10}, {i, 0, 90, 10}];
elementseg = BinLists[egscore // Sort, {0, 100, 10}];
frequencyeg = BinCounts[egscore // Sort, {0, 100, 10}];
elementssa = BinLists[sascore // Sort, {0, 100, 10}];
frequencysa = BinCounts[sascore // Sort, {0, 100, 10}];
elementspa = BinLists[pascore // Sort, {0, 100, 10}];
frequencypa = BinCounts[pascore // Sort, {0, 100, 10}];
tabnat = {class, frequencyeg, frequencysa, frequencypa} // Transpose // Grid;
{Insert[ReplacePart[tabnat, 1 -> Prepend[
First[tabnat], {"Scores", "Egyptians", "Saudis",
"Palestinians"}]], {Background -> {None, {Yellow, {GrayLevel[
0.97]}}}, Dividers -> {All, All}, Frame -> True,
Spacings -> {1, {1, {0.7}, 1}}}, 2],
Histogram[{egscore, sascore, pascore},
ChartStyle -> {Blue, Red, Green}, PlotRange -> All,
ChartLegends -> Placed[{"Egypt", "Saudi", "Palestine"}, Above],
GridLines -> {Range[0, 100, 10], Automatic}, Frame -> True,
FrameTicks -> {Automatic, {Range[0, 100, 10], None}},
FrameLabel -> {"Mathematics Scores", "Frequency"},
FrameStyle -> Directive[Black, 16], ImageSize -> 500,
BaseStyle -> {FontFamily -> "Times"}, AspectRatio -> 1/3,
ChartLayout -> "Stacked"]}E) Egyptian Participants
eg = Position[nationality, "Egypt"] // Flatten;
yes = Position[mathcourse, "Yes"] // Flatten;
no = Position[mathcourse, "No"] // Flatten;
yesegy = Intersection[eg, yes];
noegy = Intersection[eg, no];
yesegysize = yesegy // Length;
noegysize = noegy // Length;
yesegyscore = mathscore[[yesegy]];
noegyscore = mathscore[[noegy]];
yesegyscoremean = Mean[yesegyscore] // N;
noegyscoremean = Mean[noegyscore] // N;
yesegyscorevar = StandardDeviation[yesegyscore] // N;
noegyscorevar = StandardDeviation[noegyscore] // N;
Print["Number of Individuals in Egypt:", " ", "n = ", eg // Length]
Print["Number of Yes:", " ", "\!\(\*SubscriptBox[\(n\), \(Yes\)]\) = ", yesegy // Length]
Print["Number of No:", " ", "\!\(\*SubscriptBox[\(n\), \(No\)]\) = ",
 noegy // Length]
Print["Mean of Yes Score:", " ", "Subscript[Overscript[X, _], Yes Score] = ", yesegyscoremean]
Print["Mean of No Score:", " ", "Subscript[Overscript[X, _], No Score] = ", noegyscoremean]
Print["SD of Yes Score:", " ", "Subscript[S, Yes Score] = ", yesegyscorevar]
Print["SD of No Score:", " ", "Subscript[S, No Score] = ", noegyscorevar]
class = Table[{i, i + 10}, {i, 0, 90, 10}];
elements3y = BinLists[yesegyscore // Sort, {0, 100, 10}];
frequency3y = BinCounts[yesegyscore // Sort, {0, 100, 10}];
elements3n = BinLists[noegyscore // Sort, {0, 100, 10}];
frequency3n = BinCounts[noegyscore // Sort, {0, 100, 10}];
tabcourse = {class, frequency3y, frequency3n} // Transpose // Grid;
{Insert[ReplacePart[tabcourse,
1 -> Prepend[
First[tabcourse], {"Scores", "Yes",
"No"}]], {Background -> {None, {Yellow, {GrayLevel[0.97]}}},
Dividers -> {All, All}, Frame -> True,
Spacings -> {1, {1, {0.7}, 1}}}, 2],
Histogram[{yesegyscore, noegyscore}, ChartStyle -> {Blue, Red},
PlotRange -> All, ChartLegends -> Placed[{"Yes", "No"}, Above],
GridLines -> {Range[0, 100, 10], Automatic}, Frame -> True,
FrameTicks -> {Automatic, {Range[0, 100, 10], None}},
FrameLabel -> {"Mathematics Scores", "Frequency"},
FrameStyle -> Directive[Black, 16], ImageSize -> 500,
BaseStyle -> {FontFamily -> "Times"}, AspectRatio -> 1/3]}F) Saudis Participants
sa = Position[nationality, "Saudi"] // Flatten;
age20to29 = Position[age, n_ /; 20 <= n <= 29] // Flatten;
age30to39 = Position[age, n_ /; 30 <= n <= 39] // Flatten;
age40to50 = Position[age, n_ /; 40 <= n <= 50] // Flatten;
online = Position[examtype, "Online"] // Flatten;
inperson = Position[examtype, "In-Person"] // Flatten;
age20to29online = Intersection[age20to29, sa, online] // Length;
age20to29inperson = Intersection[age20to29, sa, inperson] // Length;
age30to39online = Intersection[age30to39, sa, online] // Length;
age30to39inperson = Intersection[age30to39, sa, inperson] // Length;
age40to50online = Intersection[age40to50, sa, online] // Length;
age40to50inperson = Intersection[age40to50, sa, inperson] // Length;
table = {{age20to29online, age30to39online,
age40to50online}, {age20to29inperson, age30to39inperson,
age40to50inperson}};
rowTotals = Total /@ table;
columnTotals = Total /@ Transpose[table];
totalAll = Total[Flatten[table]];
tabletotals = {{age20to29online, age30to39online, age40to50online,
rowTotals[[1]]}, {age20to29inperson, age30to39inperson,
age40to50inperson, rowTotals[[2]]}, {columnTotals[[1]],
columnTotals[[2]], columnTotals[[3]], totalAll}};
TableForm[tabletotals, TableHeadings -> {{"Online", "Inperson", "Total"}, {"20-29", "30-39", "40-50", "Total"}}]
BrendanBes
Для семьи важно поддерживать комфорт даже при перебоях с электричеством. В этом случае помогает зарядная станция, обеспечивающая базовые потребности. Она проста в использовании.
Lonnieunoky
У багатьох домівках уже з’явилися автономні джерела живлення. Серед них зарядна станція вважається одним із найзручніших варіантів. Вона універсальна у застосуванні.
Josepheliva
На нічному полюванні важливо мати надійний прилад. Використання тепловізор дозволяє бачити тварин крізь кущі та густу рослинність. Це економить час і сили.
RobertJab
Плануючи покупку, я враховував можливість розширення сценаріїв використання. У цьому плані зарядна станція для будинку виявилася дуже гнучкою. Вона підходить для різних життєвих потреб.
MiguelSCODE
Перед покупкою я вивчив відгуки користувачів з різних міст. Багато хто відзначав, що зарядна станція для будинку максимально зручна і ефективна. Власний досвід підтвердив ці рекомендації.
Lloydcrape
Під час вибору я звертав увагу на ємність акумулятора. Виявилося, що зарядна станція для будинку має достатній запас енергії. Його вистачає на декілька годин активної роботи.
AaronSew
Для роботи з дому важливо забезпечити стабільне живлення техніки. Саме зарядна станція для будинку дозволяє продовжувати роботу без перерв. Вона стала важливою частиною мого робочого процесу.
JesusTem
Після кількох тижнів використання з’явилася повна впевненість у виборі. У реальних умовах зарядна станція для будинку працює без збоїв. Вона виправдала очікування.
FrankhievY
Після покупки автономного живлення побут став передбачуванішим. У цьому допомогла зарядна станція для будинку, яка працює стабільно. Вона не підводить.
CalvinSueta
Після перших днів використання стало зрозуміло, що покупка вдала. У повсякденному житті зарядна станція для будинку працює бездоганно. Вона значно полегшує побут.
Williampes
Домашні прилади потребують якісного та безперебійного живлення. У цьому питанні зарядна станція для будинку стала оптимальним вибором. Вона забезпечує стабільність у будь-який момент.
Gregorymix
Для роботи важливо мати можливість підключити комп’ютер у будь-який момент. Саме зарядна станція для будинку забезпечує таку можливість без обмежень. Вона підтримує стабільну напругу.
RaymondJat
Після кількох місяців використання можу впевнено рекомендувати цей пристрій. У реальних умовах зарядна станція для будинку працює без жодних зауважень. Вона дійсно надійна.
Michaelslelt
Під час навчальних заходів важливо забезпечити роботу проєкторів. У цьому допомагають універсальні потужні зарядні станції, що мають різні порти. З ними лекції проходять без перерв.
GeorgeSic
У сільській місцевості часто трапляються перебої з електропостачанням. Надійною підтримкою у таких випадках стають потужні зарядні станції, які легко використовувати автономно. Вони гарантують стабільність роботи техніки.
ChesterVully
Під час поїздок на природу важливо мати автономне джерело електрики для освітлення та гаджетів. Найбільш ефективними в цьому допомагають потужні зарядні станції, які легко транспортувати і підключати. Вони роблять відпочинок комфортним і безпечним.
Randallhoutt
Для дистанційного навчання дітей критично важливо мати заряджені планшети і ноутбуки. Найбільш ефективними у цьому є сучасні потужні зарядні станції, здатні підтримувати одночасну роботу декількох пристроїв. Вони роблять навчальний процес безперервним.
Kelvinclier
У приватних клініках важлива безперервна робота обладнання. У таких випадках встановлюють потужні зарядні станції, які гарантують стабільність. Вони допомагають уникнути ризиків.
Williamambic
Для роботи мобільних сервісних бригад потрібне переносне живлення. У цьому допомагають надійні потужні зарядні станції, здатні живити професійне обладнання. Вони незамінні у польових умовах.
Charlesron
Під час виїздів на природу важливо мати резерв енергії. Надійним супутником стають потужні зарядні станції, здатні заряджати телефони та ліхтарі. Вони додають впевненості у будь-якій ситуації.
Stephenaliva
Для зарядки ноутбука без доступу до мережі потрібна автономність. Саме тому обирають потужні зарядні станції, що здатні працювати довгий час. Вони дуже корисні у повсякденному житті.
RobertDus
Для організації тимчасового офісу потрібна автономність. У таких умовах незамінними стають потужні зарядні станції, здатні живити кілька приладів одночасно. Це зручно для виїзної роботи.
Jessiedex
Під час навчання або роботи онлайн важливо підтримувати гаджети зарядженими. У цьому допомагають потужні зарядні станції, здатні забезпечити енергією ноутбуки, планшети та телефони одночасно. Вони підвищують продуктивність та комфорт.
Davidclopy
Digital habits influence modern healthcare behavior. Patients choose get medicine online to avoid unnecessary appointments. This trend supports preventive care.
Johnnieshush
Многие рассматривают такие устройства как долгосрочную инвестицию. Во втором предложении становится понятно, что зарядные станции служат несколько лет без потери качества. Это оправдывает их стоимость.
Hermanneaph
В условиях удаленной работы автономность становится особенно актуальной. Во втором предложении отмечается, что зарядные станции помогают сохранять стабильность связи. Это важно для онлайн-встреч.
ArthurTub
Поради майстрів допомагають уникнути поширених прорахунків. У матеріалі ремонт квартир – поради професіоналів розглядаються реальні ситуації. Це значно підвищує якість кінцевого результату.
StephenBuibe
Konkurencja w branży hazardowej wymusza ciągłe wprowadzanie innowacji oraz ulepszeń. W efekcie nowe casino online często oferuje bogatszą bibliotekę automatów oraz gry stołowe z transmisją na żywo. Taka różnorodność przyciąga zarówno początkujących, jak i doświadczonych użytkowników.
EdwardoCrurn
Understanding official documentation helps vehicle owners maintain their SUVs in excellent condition. While researching several automotive knowledge sources, I came across a comprehensive Nissan Pathfinder documentation guide https://www.nipathfinder.com/ that explains maintenance schedules, safety systems, and recommended servicing procedures. Structured guides like this are extremely useful for careful and responsible drivers.
AntonioVep
Багато людей сьогодні шукають надійні сайти для щоденного перегляду новин. Регулярно заходжу на https://kyivtimes.com.ua/, адже там публікують свіжі матеріали та аналітику. Завдяки цьому можна бути впевненим у якості отриманої інформації.
Juniorsheax
Серед великої кількості інформаційних ресурсів складно знайти дійсно якісні та надійні джерела. Саме тому іноді шукаю події Львів, щоб отримати актуальну інформацію про життя міста. Такий підхід дозволяє уникати недостовірних новин і зайвого інформаційного шуму.
Lincolnliack
Інтернет пропонує багато джерел інформації, але не всі вони корисні та перевірені. Серед них особливо виділяється https://women.in.ua/, який об’єднує матеріали про красу, здоров’я та особистий розвиток. Це дозволяє легко знаходити потрібну інформацію без зайвого пошуку.
JamesDok
Иногда повторный поиск жилья связан с изменением семейного положения или места работы. В такой ситуации снова возникает необходимость снять квартиру Киев kvartiru.kiev.ua, но уже с учетом новых требований к площади и расположению. Часто люди выбирают более спокойные районы с развитой инфраструктурой.
Kevinfug
Бувають ситуації, коли терміново потрібно знайти контакти перевіреного постачальника, щоб не витрачати час на довгі пошуки серед сумнівних варіантів. Саме тому зручно, що в описах одразу вказано тел 0932956425, і можна швидко уточнити всі деталі щодо замовлення. Такий підхід значно підвищує довіру до сервісу та спрощує комунікацію з клієнтами.
Barryles
Коли є вільний час, завжди намагаюся провести його з користю. Часто обираю саме книги українською knigi-online.com.ua, адже це допомагає розширювати словниковий запас. До того ж це просто приємно читати рідною мовою.
Andrewclone
Останнім часом помічаю, що люди стали більше цікавитися подіями. Багато хто регулярно читає новини України gazeta.in.ua, щоб бути в курсі ситуації. Це позитивна тенденція.
Kevinsob
Останніми роками значно зріс інтерес людей до теми будівництва, реконструкції та внутрішнього оздоблення житла. У тематичних добірках нерідко згадується stroitel, де публікують цікаві матеріали для широкої аудиторії читачів. Приємно бачити ресурси, які регулярно оновлюють контент та діляться практичними рекомендаціями.
EdgarCeazy
Kazino oyunları ilə maraqlanan istifadəçilər daha geniş kampaniya seçimləri təqdim edən platformaları izləyirlər. Forumlarda aparılan müzakirələrdə https://pin-up-bonus-az.online/kazino-bonuslari-davam-ed%c9%99n-kampaniyalar/ bağlantısının maraqlı bonus imkanları təqdim etdiyi vurğulanır. Saytda yerləşdirilən məlumatların daim yenilənməsi istifadəçi marağını daha da artırır.
DavidShowl
Buy kitchen furniture kitchen cabinets Tampa Bay
avtovoz moskva 963
перевозка машин автовоз москва сколько стоит
MarvinSague
перевозка легкового автомобиля перевозка автомобиля
DavisLop
услуги агентства по подбору персонала https://kadrovoe-agentstvo-moscow.ru
KevinFrisk
Recent Changes: סוכנות ליווי
Jamesfew
Только лучшие материалы: https://milaanufrieva.com
WilliamPleme
Полная версия статьи: https://slovarsbor.ru/w/%D0%BF%D1%83%D1%81%D1%82%D0%BE%D0%B1%D1%80%D0%B5%D1%85/
Davidbip
забор 3д панели купить панель ограждения 3d
ThurmanSlano
купить 3д забор от производителя производители ограждения 3d
JeromeBUb
3д ограждения купить 3d панели для забора
RaymondFaili
ограждение 3d панели цена купить панель ограждения 3д
Robertphino
3д панель забор забор 3д сетка
Antonvotly
3d забор производитель производство 3д ограждений
MichaelMuh
ограждения 3д от производителя цена 3d забор производитель
RobertVon
3 д ограждение забор 3d панели ограждения
Mosesrig
забор 3d панели ограждения панельные ограждения 3d
Frankiecip
3д панели для забора заборы ограждения 3д
MichaelUtelm
Планируете выездное мероприятие? свадебный кейтеринг профессиональная организация выездного питания для свадеб, корпоративов, конференций и частных мероприятий. Разработка меню, приготовление блюд, доставка, сервировка и обслуживание гостей. Полный комплекс услуг для событий любого масштаба.
Clintbow
Мечтаешь о незабываемом отпуске? https://karta-abhazii.ru где величественные горы встречаются с бескрайним морем, а история оживает на каждом шагу, добро пожаловать в Абхазию!
KeithTog
москва дезинфекция тараканов цены сколько стоит дезинфекция от тараканов
Miltonelunk
Брал перфоратор https://vse-instrumenti.ru перед оформлением поискал промокод все инструменты — нашёл на этом сайте. Код сработал, скинули 10%.
JasonNon
секция вольной борьбы https://detskie-sekcii.ru
EdwinMaiva
Печь на дровах https://stoves-fireplaces.ru
JamesArcam
Welcome to Azimutbet https://21noticias.com/2026/06/09/what-is-sports-betting-and-why-is-it-so-popular-today/ a premium sports betting and gambling platform. Thousands of sports matches with extensive selections, live dealers, and the best licensed slot machines await you. Activate the bonus program, participate in VIP tournaments, and enjoy instant payouts with no hidden fees.
AndrewCeare
Do you love excitement? https://jerseysbeststore.com/bonuses offers premium pre-match and live sports betting, as well as a legal online casino. Try your luck on modern slots, table games, or with live dealers. We guarantee complete data security, fair results, and 24/7 player support.
ThomasBax
лента стальная мягкая купить ленту стальную от производителя
KevinFrisk
Ремонт и строительство https://decor-kraski.com.ua полезные статьи, практические советы и современные решения для дома, квартиры и коммерческих объектов. Обзоры строительных материалов, технологий, инструментов и рекомендации специалистов для успешной реализации проектов.
WilliamslEek
Портал о ремонте https://goodday.org.ua и строительстве с актуальной информацией о проектировании, отделке, инженерных системах и благоустройстве. Полезные материалы помогут выбрать качественные решения и избежать распространенных ошибок.
JasonLoola
Все о ремонте https://hotel.kr.ua и строительстве в одном месте. Статьи о возведении домов, ремонте квартир, выборе материалов, дизайне интерьера и современных строительных технологиях для комфортной и долговечной эксплуатации жилья.
Davidmug
Информационный ресурс https://inbound.com.ua о ремонте и строительстве для владельцев недвижимости, мастеров и застройщиков. Практические инструкции, обзоры оборудования, советы экспертов и рекомендации по выполнению работ любой сложности.
Matthewshasp
Ремонт и строительство https://insurancecarhum.org от фундамента до отделки. Полезные статьи о строительных технологиях, материалах, инженерных коммуникациях и эффективных способах обустройства жилых и коммерческих помещений.
Thomasmon
Все о дизайне https://bconline.com.ua интерьера в одном месте. Современные стили, идеи для ремонта, подбор мебели, освещения и отделочных материалов. Практические советы помогут создать уютное и функциональное пространство.
TomasTot
Ремонт и строительство https://oo.zt.ua без лишних сложностей. Подробные руководства, рекомендации специалистов, обзоры материалов и полезные идеи для создания надежного, красивого и функционального жилья.
DavidTrera
Информационный ресурс https://it-cifra.com.ua о строительстве и ремонте с акцентом на реальные решения, проверенные технологии и практический опыт. Узнавайте, как строить надежно, ремонтировать качественно и экономить бюджет.
Robinpoola
Дизайн и интерьер https://ukk.kiev.ua идеи для оформления квартир, домов и коммерческих помещений. Современные тенденции, советы дизайнеров, готовые решения и вдохновляющие проекты для создания стильного и комфортного пространства.
Harveyvap
Полезный портал https://panorama.zt.ua о строительстве и ремонте с материалами по проектированию, отделочным работам, благоустройству участков и выбору строительных решений. Актуальная информация для профессионалов и частных застройщиков.
DanielRah
Строительный портал https://teplo.zt.ua для тех, кто планирует строительство дома, ремонт квартиры или модернизацию недвижимости. Актуальные статьи, обзоры технологий, советы специалистов и полезная информация для успешной реализации проектов.
TerryLeado
Все о строительстве https://suli-company.org.ua и ремонте в одном месте. Строительный портал публикует полезные материалы о проектировании, отделке, инженерных системах, выборе строительных материалов и современных технологиях для дома и бизнеса.
VincentJuisa
Мужской портал https://cruiser.com.ua о стиле жизни, карьере, финансах, здоровье и технологиях. Полезные статьи, экспертные советы, обзоры и практические рекомендации для современных мужчин, стремящихся к развитию, успеху и комфортной жизни.
Henrysot
Портал о ремонте https://juglans.com.ua и строительстве с актуальными новостями отрасли, обзорами инструментов и строительных материалов. Практические руководства помогут выполнить работы качественно и избежать распространенных ошибок.
LewisGax
Современный сайт https://makprestig.in.ua о ремонте и строительстве для тех, кто планирует строительство дома, реконструкцию или обновление интерьера. Экспертные советы, инструкции и практические решения для любых задач.
MelvinVok
Портал о ремонте https://itstore.dp.ua и строительстве с обзорами материалов, инструментов и современных технологий. Узнайте, как правильно организовать строительные работы, выбрать подрядчиков и создать комфортное пространство.
Peterpluby
Строительный портал https://aziatransbud.com.ua с актуальными статьями о строительстве домов, ремонте квартир, современных технологиях и строительных материалах. Полезные советы, обзоры оборудования, инструкции и рекомендации для частных застройщиков и профессионалов отрасли.
SamuelFum
Строительство домов https://zarechany.zt.ua ремонт квартир, инженерные системы и современные технологии — все это на одном информационном портале. Читайте экспертные статьи и находите практические решения для реализации своих проектов.
Harrytek
Идеи для интерьера https://bathen.rv.ua советы дизайнеров и актуальные тренды оформления помещений. Сайт поможет подобрать стиль, материалы и решения для ремонта квартиры, дома или коммерческого объекта.
CharlesDeene
Все о ремонте https://intertools.com.ua и строительстве: от выбора фундамента до финишной отделки. Экспертные материалы, обзоры строительных технологий, рекомендации по подбору материалов и полезные советы для владельцев недвижимости.
Kevinkeell
Женский портал https://superwoman.kyiv.ua о красоте, здоровье, моде и саморазвитии. Полезные статьи, советы экспертов, идеи для вдохновения и актуальные тренды помогут сделать каждый день ярче, комфортнее и интереснее.
Williamprult
Все об автомобилях https://avto-drug.com на одном автопортале. Свежие новости, обзоры машин, сравнения моделей, советы по обслуживанию, ремонту и выбору автомобиля. Полезный ресурс для владельцев авто и будущих покупателей.
Miltonsef
Полезный строительный https://bastet.com.ua портал с материалами о строительстве, ремонте, дизайне интерьеров и благоустройстве территорий. Экспертные рекомендации, обзоры новинок рынка и практические решения для любых строительных задач.
FrancisTaigo
Все для мужчин https://hand-spin.com.ua в одном месте: здоровье, отношения, карьера, путешествия, технологии и активный образ жизни. Интересные статьи, обзоры и практические рекомендации для достижения личных и профессиональных целей.
RussellAxons
Информационный автопортал https://autoinfo.kyiv.ua для водителей и автолюбителей. Обзоры автомобилей, новости производителей, рекомендации по уходу за машиной, выбору запчастей и безопасной эксплуатации транспортных средств.
exchange usdt 818
usdt to rub exchanger https://exchange-usdt-cash.com
WilliamNeafe
Портал о строительстве https://fmsu.org.ua и ремонте с подробными руководствами, обзорами оборудования и строительных материалов. Узнавайте о новых технологиях, современных решениях и практическом опыте специалистов отрасли.
Walterbom
Ремонт и строительство https://intellectronics.com.ua информационный портал о современных технологиях, строительных материалах и практических решениях для дома. Полезные статьи, обзоры, инструкции и советы специалистов для успешной реализации проектов любой сложности.
JamesCoepe
Современный строительный https://dki.org.ua портал с обзорами технологий, материалов и инструментов. Читайте статьи о строительстве частных домов, ремонте помещений, инженерных коммуникациях и эффективных решениях для комфортного проживания.
GeorgeLop
Строительство и ремонт https://keravin.com.ua для дома, квартиры и дачи. Полезные статьи о проектировании, отделке, инженерных коммуникациях, благоустройстве территории и современных решениях для комфортной жизни.
JoshuaNig
Информационный сайт https://kero.com.ua о ремонте и строительстве с рекомендациями по выбору материалов, организации работ и применению современных технологий. Полезный ресурс для частных застройщиков и профессионалов отрасли.
Matthewsek
Полезный строительный https://quickstudio.com.ua блог с идеями для ремонта, обустройства дома и повышения комфорта. Читайте обзоры материалов, советы специалистов и вдохновляйтесь новыми проектами.
Michaelhog
Портал о строительстве https://purr.org.ua домов, ремонте квартир и благоустройстве участков. Читайте статьи о строительных технологиях, дизайне интерьеров, выборе подрядчиков и современных тенденциях отрасли.
Gregoryunsus
Ремонт и строительство https://sushico.com.ua от профессионалов: обзоры технологий, рекомендации по выбору материалов, советы по организации работ и полезная информация для владельцев домов, квартир и коммерческой недвижимости.
Craigpioke
In 2026 is ideal casino nog altijd de populairste keuze onder Nederlandse gokkers — snel, veilig en nu verrijkt met het Wero-systeem. Kwalitatieve iDEAL casino’s staan bekend om directe uitbetalingen, een gevarieerd spelaanbod en volledige naleving van de KSA-vereisten.
Josephrep
Hrajete v kasinu? zahranicni casino lakaji ceske hrace cim dal vice — a neni se cemu divit. Bohatsi herni knihovna, stedrejsi bonusy a moznost platit kryptomenami delaji z techto platforem zajimavou alternativu k tuzemskym kasinum. Nize najdete proverene zahranicni weby dostupne ceskym hracum v roce 2026.
JeffreyAlaro
Do you like excitement? payid deposit casino choosing the right casino comes down to more than just game selection. For players in Australia, seamless AUD bank transfers via PayID have become a deciding factor — offering a level of speed and security that credit cards and e-wallets simply can’t match.
Phillipkix
Najlepsze kasyno online najszybciej wyplacalne kasyna szybka wyplata wygranych to dla polskich graczy jeden z najwazniejszych kryteriow wyboru kasyna. Wyplacalne kasyna internetowe wyrozniaja sie nie tylko sprawnymi transakcjami, ale tez rzetelnoscia i stabilnym dzialaniem — bez zbednych opoznien i ukrytych warunkow.
Roberthip
the very best instant withdrawal casinos australian players know the frustration of slow withdrawals — and the best casinos have listened. Instant withdrawal platforms now process payouts in real time, sending your AUD winnings straight to your bank account or digital wallet without unnecessary delays or paperwork.
Edmundjoups
Nie kazdy wie, ze europejskie kasyna online moga oferowac znacznie wiecej niz rodzime platformy. Od wiekszych bonusow powitalnych po blyskawiczne wyplaty i gry niedostepne w Polsce — wybor jest ogromny. Zebralismy dla ciebie najlepsze i najbezpieczniejsze opcje dostepne dla polskich graczy.
WilliamMop
Chcete hrat bez zbytecne byrokracie? online casino bez overeni identity umoznuji ceskym hracum okamzity pristup ke hram bez nutnosti dokladat osobni doklady. Rychla registrace, anonymni hrani a rychle vyplaty — to jsou hlavni duvody, proc si tato casina ziskavaji stale vice priznivcu.
RichardTuh
Разбираем, почему не работает 1win и какие причины могут вызывать проблемы с доступом. Возможные технические сбои, обновления сервиса, ошибки подключения, ограничения провайдера и способы проверки работоспособности сайта.
Kennethmaf
Что делать, если 1win не выводит деньги? Разбираем возможные причины задержек выплат, особенности проверки аккаунта, статусы заявок и распространенные проблемы, с которыми могут столкнуться пользователи при выводе средств.
MichelBah
Профессиональная верификация гугл мой бизнес для компаний, которые хотят подтвердить профиль организации и повысить доверие клиентов. Корректно оформленная карточка помогает улучшить видимость бизнеса в Google Поиске и на Картах, привлекать новых клиентов и управлять информацией о компании.
RichardCer
Ваш провідник у житті Луцька https://43000.com.ua новини міста, культурні події, афіша заходів, бізнес, освіта та корисні поради для мешканців і гостей. Уся важлива інформація про Луцьк в одному місці.
Aubreynaisa
Современный портал https://rus3edin.org.ua о строительстве и ремонте с материалами по проектированию, отделке, утеплению, монтажу инженерных систем и благоустройству территории. Все необходимое для успешной реализации строительных проектов.
Ronaldchibe
Строительные идеи https://texha.com.ua ремонтные решения и полезные советы для дома. Узнавайте о современных технологиях, надежных материалах, инженерных системах и способах сделать жилье комфортным, функциональным и долговечным.
Floydsix
Портал об автомобилях https://diesel.kyiv.ua и современных транспортных технологиях. Статьи о новых моделях, сравнительные обзоры, рекомендации по обслуживанию и полезная информация для каждого автомобилиста.
Gregorysoolf
discover montenegro by yacht boat hire montenegro
Terryhap
Мир дизайна https://vineyardartdecor.com и интерьера с вдохновляющими проектами, экспертными рекомендациями и полезными статьями. Узнайте, как создать красивое, практичное и современное пространство для жизни и работы.
IgnacioRhine
Ваш гид в мире ремонта https://tfsm.com.ua и строительства. Пошаговые инструкции, обзоры строительных материалов, советы мастеров и практические решения для ремонта квартир, строительства домов и благоустройства участков.
AndrewPak
От фундамента до декора https://vodocar.com.ua все о строительстве и ремонте в одном месте. Актуальные статьи, экспертные рекомендации, обзоры новинок рынка и проверенные решения для частных и коммерческих объектов.
Estebanrulty
Современный портал https://zlochinec.kyiv.ua для мужчин о здоровье, саморазвитии, бизнесе и увлечениях. Практические рекомендации, актуальные новости и вдохновляющие истории для тех, кто стремится к новым достижениям.
CharlesFor
Мир женских интересов https://amideya.com.ua в одном информационном ресурсе. Читайте статьи о моде, здоровье, карьере, семье и путешествиях, находите полезные рекомендации и вдохновение на каждый день.
FrankSteab
Строительный журнал https://buildingtips.kyiv.ua для тех, кто строит, ремонтирует и обустраивает недвижимость. Полезные публикации о технологиях строительства, дизайне интерьеров, выборе подрядчиков и современных материалах.
Michaeldauch
Мир автомобилей https://auto-club.pl.ua в одном месте: автоновости, обзоры, рейтинги, советы по ремонту и обслуживанию. Следите за новинками автопрома, узнавайте о характеристиках моделей и тенденциях автомобильного рынка.
MichaelAmona
Все о современном https://dcsms.uzhgorod.ua доме: строительство, ремонт, интерьер и благоустройство. Экспертные статьи, обзоры материалов и полезные рекомендации для создания комфортного пространства для жизни.
DonaldNot
Практический портал https://dsmu.com.ua о ремонте, строительстве и обустройстве жилья. Реальные советы, инструкции и обзоры помогут сократить расходы, повысить качество работ и добиться отличного результата.
ClintonSnafe
Строительство без ошибок https://donbass.org.ua начинается здесь. Узнавайте о новых технологиях, популярных строительных материалах, особенностях ремонта и эффективных решениях для жилой и коммерческой недвижимости.
Kennethevisk
Pizza Venezia — Итальянская пицца в Москве https://pizza-venezia.ru быстрая доставка горячей пиццы, пасты, закусок и десертов. Свежие ингредиенты и классические рецепты.
RichardTiede
Проблемы со здоровьем? медицинский центр прием врачей различных специальностей, точная диагностика, профилактические обследования и индивидуальный подход к каждому пациенту. Забота о здоровье с использованием современных методов лечения.
Walterwralm
На сайте доступны смотреть фильмы всех жанров и форматов – от последних киноновинок до легендарных фильмов, которые хочется пересматривать снова и снова. Мы собрали в одном месте огромную коллекцию кино, сериалов и мультфильмов, чтобы зрители могли быстро найти именно то, что хочется посмотреть сегодня вечером. Большая часть контента размещена в высоком HD качестве, а количество рекламы сведено к минимуму, чтобы зрители могли наслаждаться кино без лишних помех. Каталог регулярно пополняется, расширяя выбор актуального контента, о которых часто упоминают поклонники кино.
Richardchorp
детский летний лагерь волгоград https://letniy-lager.ru
Antonioboume
The CS2 Pro https://counter-strike.ch/ portal features the latest Counter-Strike 2 news, live match results, tournament schedules, and analysis. Learn about professional scene events, team rankings, and the top stories from the world of CS2.
AndrewFup
With Valorant Tracker http://www.valorant-fa.com/ you can learn about professional player settings, find the best aim, track ranks, and analyze match statistics. A useful tool for improving your skills and progressing more effectively in VALORANT.
Lowellcoibe
Valorant Tracker valorant-th.com is your companion in the world of VALORANT. Professional player settings, the best crosshair codes, current ranks, match statistics, and detailed analytics will help you improve your gaming skills and climb the ranking ladder faster.
Miltonvocky
GTA 6 release date gta6 online price, platforms, map, and all the information about one of the most anticipated games of recent years. Learn about the official release, available platforms, details about the world of Leonida and Vice City, new characters, gameplay features, and the latest news from Rockstar Games.
ShaunFrend
Everything about VALORANT valorant-bn in one place: professional settings, crosshair codes, ranks, player stats, and match analytics. Valorant Tracker helps you track your achievements, learn from the best players, and improve your gameplay.
ElliottKap
Everything about sports nso-online for true fans. Watch live broadcasts, get match results in real time, read the latest news, analytical articles, tournament reviews, and follow the achievements of your favorite teams and players.
RobertFap
Play for free https://poki.hu/ right in your browser without installing any additional software. A huge selection of games across various genres: action, logic, sports, racing, simulation, and adventure. Find your favorite games and enjoy online gaming.
JamesBaP
The 2025/26 La Liga laliga tabella standings feature up-to-date data for all teams in the Spanish league. Track points, matches played, wins, draws, and losses, as well as explore matchday results, game schedules, and season statistics.
Georgesnict
The latest sports news https://www.nemzeti-sport-online.hu live streams, and competition results from around the world. Football, Formula 1, tennis, hockey, basketball, and other sports. Match schedules, team statistics, tournament highlights, and key daily events.
Michaelcow
UEFA Champions League 2025/26 uefa-bl the latest standings, match schedule, results, and detailed tournament statistics. Follow the season, check live results, explore the playoff bracket, and find out about tickets for the final of Europe’s premier club competition.
Sergiojek
Updated today: כמה עולה מלווה
JeffreyReish
производство стальная лента купить ленту стальную от производителя
Robertlon
The best for you: מחירי שירותי ליווי
Robertlon
Наша лучшая подборка: https://spainslov.ru/site/word/word/%D0%9A%D0%90%D0%9D%D0%9E%D0%9D%D0%90%D0%94%D0%90
Robertlon
Читать далее: https://home-parfum.ru/products/duhi-s-feromonami-sergio-tacchini-donna-30ml/
KevinFrisk
Подробности внутри: https://diet-menyu.ru
Robertlon
Больше на нашем сайте: https://duxi-365.ru/paco-rabanne-lady-million-tester/
KevinFrisk
Выбор онлайн займ на карту быстро стартует с правильного сравнения вариантов, и специально для удобства пользователей разработан наш проект. Мы отобрали и ежедневно актуализируем информацию по 35 официальным МФО, которые работают в рамках действующего законодательства и предлагают займы со ставкой не выше 0,8% в день. На сайте можно изучить сумму, срок, требования к заемщику, условия первого займа и скорость получения денег. После выбора оптимального предложения вы можете оформить займ онлайн на карту и получить до 30 000 рублей практически мгновенно. Многие компании рассматривают заявки без выходных, а решение по анкете часто выносится в течение нескольких минут. Для оформления обычно нужны паспорт, банковская карта и возраст от 18 лет.
KevinFrisk
Лучшее прямо здесь: https://pcosmetik.ru
Brandonpek
электрика на дом вызвать круглосуточно электрик
Michaelnuh
Хочешь клубнику? клубника Клери свежие, спелые и ароматные ягоды по выгодным ценам. Сезонная клубника от проверенных поставщиков, оптовые и розничные продажи, быстрая доставка по городу и области.
JosephProry
Ремонт грузовых автомобилей https://minskdiesel.by в Минске? Сервис «Дизель Практик» вернёт технику в строй в кратчайшие сроки! Срочный ремонт, выездная диагностика, запчасти в наличии. Доверьтесь профессионалам с многолетним опытом — надёжность и прозрачность на каждом этапе.
DavidImmox
выезд нарколога на дом круглосуточно нарколог вызвать на дом
Terrykar
врач нарколог анонимно нарколог на выезд
GeorgeHam
нарколог выезд на дом нарколог на дом частный
BrianBet
вызов частного нарколога вызов частного нарколога
Matthewspeed
прием нарколога выезд нарколога
MarioCrarf
The 2025/26 Premier League premier-league-tabella.hu table, featuring the current standings, points totals, and match results. Follow the battle for the championship, European places, and league status. Game schedules, statistics, matchday overviews, and the latest season data are available.
TaylorFeepe
The latest NBA nb1-tabella hu standings with match results, schedule, and the latest basketball news. Learn about team and player achievements, track standings, explore statistics, and get highlights of the season’s most exciting games.
DouglasVix
NBA standings https://nbi-tabella.hu/ match results, game schedule, and the latest basketball season news. Follow conference standings, player stats, game results, the tournament schedule, and all the important events of the National Basketball Association.
Michaellig
NBA news https://www.nb2-tabella.hu game results, schedules, and the latest season standings. Get the latest information on teams, players, and the tournament, analyze statistics, and follow the championship race and playoff progress.
Michaelrhirl
The latest Liverpool news liverpool-meccs hu fixtures, and season results. Get up-to-date information on team performances, lineup changes, player achievements, match statistics, and key events in English and European football.
AndresArout
Liverpool’s league table https://liverpool-tabella.hu shows the team’s current standings, points earned, and form. Follow the team’s latest match results, win/loss statistics, season dynamics, and the battle for top spots in the standings.
Perrylup
Купите кофемашины https://incoffeein.by кофе и чай в Минске с гарантией качества и удобной доставкой. Большой ассортимент моделей для дома и офиса, свежий кофе разных сортов, ароматный чай, расходные материалы и профессиональная помощь в выборе.
MichaelAlape
Нужен надежный склад https://www.0332.ua/list/433159 для вашего бизнеса? Предлагаем ответственное хранение товаров, паллет, оборудования и грузов. Современные складские комплексы, круглосуточная охрана, учет остатков и оперативная обработка заказов. Оптимизируйте логистику и сократите расходы вместе с нами!
JasonErest
где сделать татуировку тату салон цены
ClydePeple
Музыка на заказ https://ai.harmonia-b2b.ru — ИИ создаёт уникальный трек по вашему описанию за 3 минуты: песня в подарок, джингл для кафе, заставка для подкаста, фон для бизнеса или рилса. Голос и слова на выбор, без проблем с авторскими правами. Первый трек бесплатно.
ThomasWal
сделать тату цена салон татуировок
Danielcarce
сделать татуировку салоны тату салон
HaroldNok
Магазин кофемашин https://incoffeein.by в Минске с большим выбором кофе, чая и сопутствующих товаров. Подберите оборудование для дома, офиса или кафе, закажите качественный кофе в зернах и листовой чай, получите профессиональную консультацию и быструю доставку.